
PLATO-R plots for the last month
Welcome to the PLATO-R plots page. Here you can find many of the parameters that we monitor to make sure everything is running smoothly.
The page is divided into several categories: Instrument Module, Batteries, Solar power, Engine Module, Diesel engines, Current flow, Bus voltages, and Miscellaneous.
Click on any plot to enlarge it. In the image caption there are links to large versions of the plots in PNG format. Also in the caption you might notice the text (quick-link). If you bookmark or email this link, it provides a direct jump to the graph of interest.
All times are in UTC and the plots have a vertical black bar that indicates the time when the plot was generated. This bar lets you know how old the data are and when the last update occurred. The plots are updated regularly. The side bar has links to plots of different time intervals if you need a closer look at what is happening now, or want to see what happened in the past.
Instrument Module
The Instrument Module contains most of the scientific experiments, the 20kWHr LiFePO4 battery pack, the Iridium communications equipment, the Linux supervisor computers, and the solar panel power supplies. The plots below show some parameters relevant to these systems.
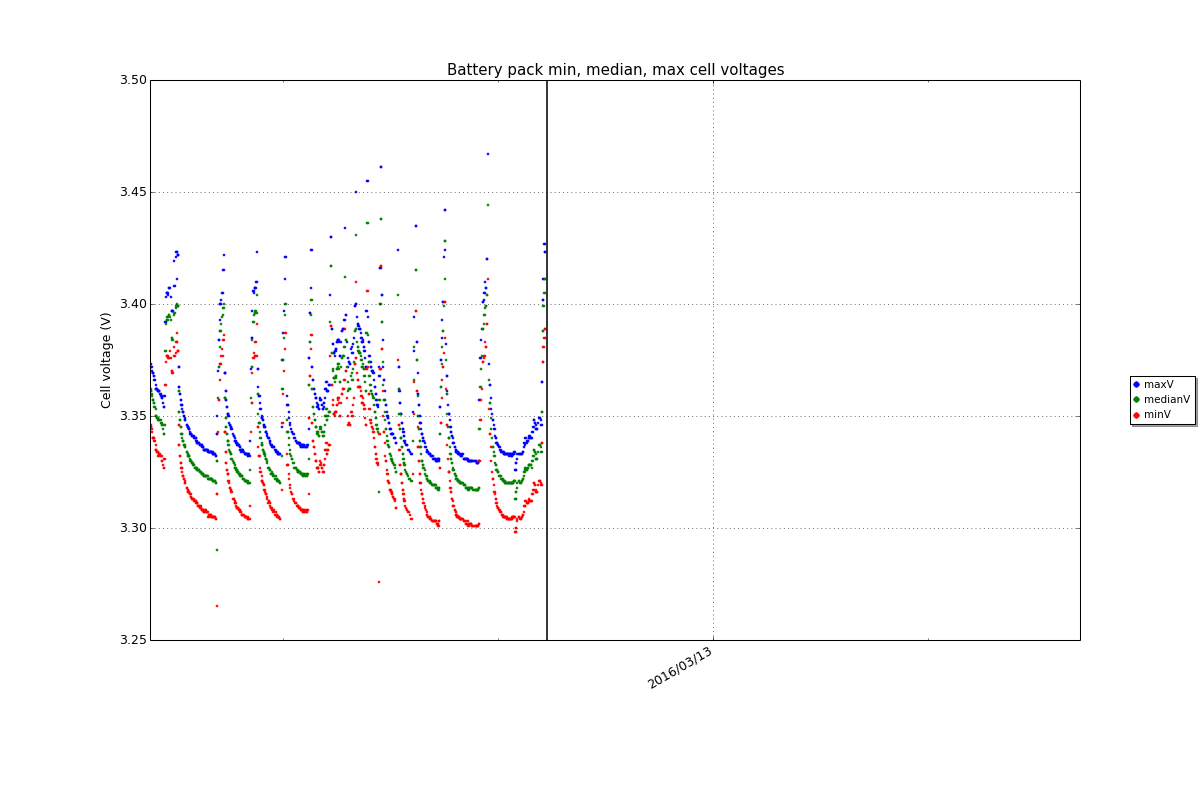
Batteries
The plots below show the voltages, currents, and temperatures of the 20kWHr LiFePO4 battery pack. The batteries consist of three parallel "strings" of thirty-six 60Ah LiFePO4 cells. Each string is nominally 120VDC. Each cell is typically about 3.3V, and varies from 2.8V when almost completely discharged up to an absolute maximum allowed voltage of 4.25V. Once a cell is charged to about 3.4 volts, it rapidly increases in voltage if charging continues.
In the first six plots below, each string is divided into two groups of 20 cells (4 of the cells out of the 40 aren't present, and read as zero).
The three strings themselves are divided into 4.5 modules of 8 cells, with each module controlled by one "node".

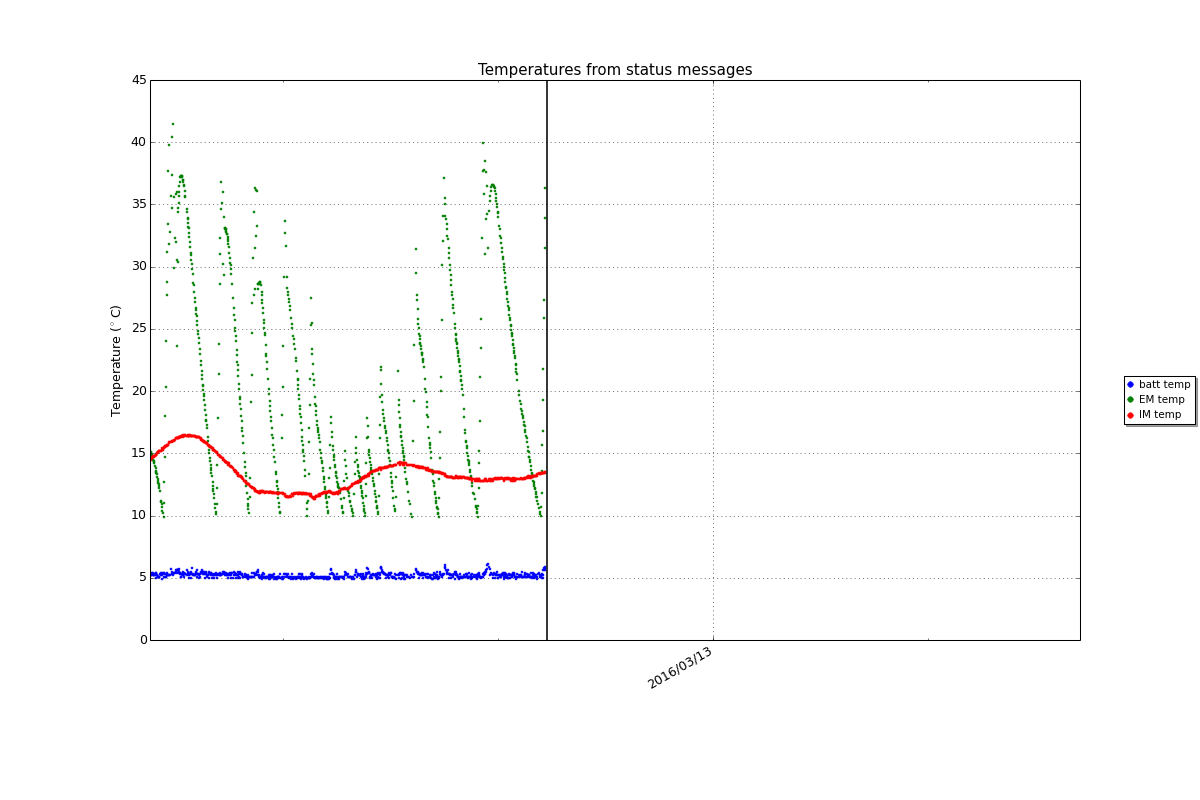
 The temperatures of the batteries, Instrument Module, and Engine Module, from the PLATO status messages. Note that the plots can appear to be double-valued, since the temperatures are derived by choosing between multiple sensors. (PNG, Quick-Link)
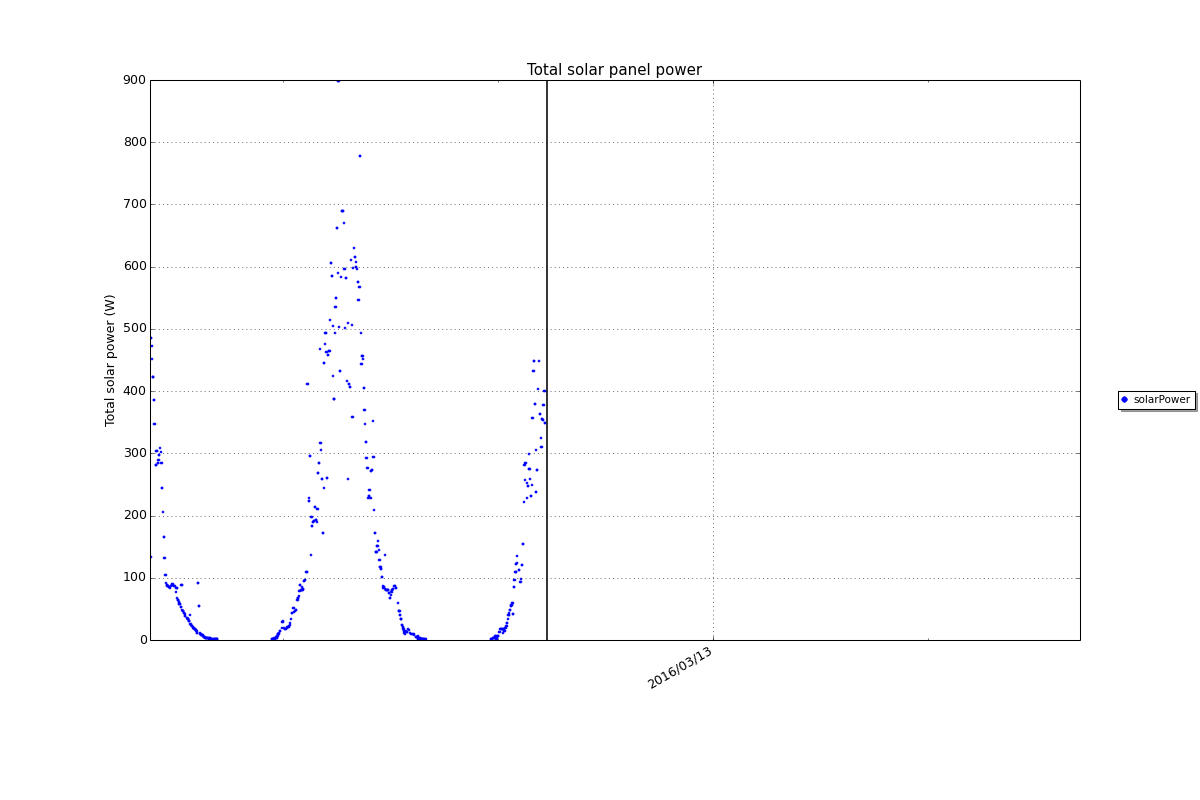
Solar power
PLATO-R has four pairs of 195W solar panels. Each pair faces a different direction, and feeds into an individual Maximum Power-Point Tracker (MPPT). The plots below show various parameters associated with the solar power.
When the sun is down, the plots don't show any data.

Engine Module
The PLATO-R Engine Module contains two Hatz 1B-30 diesel engines, 800 litres of kerosene, and various electronic control systems.
Diesel engines
The two Hatz 1B-30 diesel engines in PLATO-R are connected to three-phase alternators with a capacity of about 1.5kW. The engines are controlled by Tritium WaveSculptors, which not only allow us to start the engines (by driving current into the alternators), but give us precise load control.
 The WS22 drive setting, as a fraction of full power. This comes from the PLATO status messages. (PNG, Quick-Link)
Thermal management
The plots below show ...
HEAT
The plots below show ...
Current flow
The plots below show ...
Bus voltages
The plots below show...
Miscellaneous
The plots below show...